What is SPSS?
SPSS stands for statistical package for the social science. It
is
powerful for performing - data
entry, data cleaning, data management, data
analysis, and
produce effective output.
SPSS has three significance Windows
Data Editor window - it comprises two significance words that researcher needs to remember and well understand about it. Variable view is the place that researcher employs to perform the data coding (develop questionnaire form for data entry). Data View is place where researcher can entry the data as well as it illustrate researcher to see clearly all of the data.
Figure 1: IBM SPSS Statistics Data Editor
Syntax Editor window - researcher can type the command that they would like to run the data analysis. In addition, researcher can paste the Syntax Editor by just only click on "Paste". Then, researcher can receive a beautiful command. It is very significance for data cleaning and analyzing within large sample size and contain many variables.
Figure 2: IBM SPSS Statistics Syntax
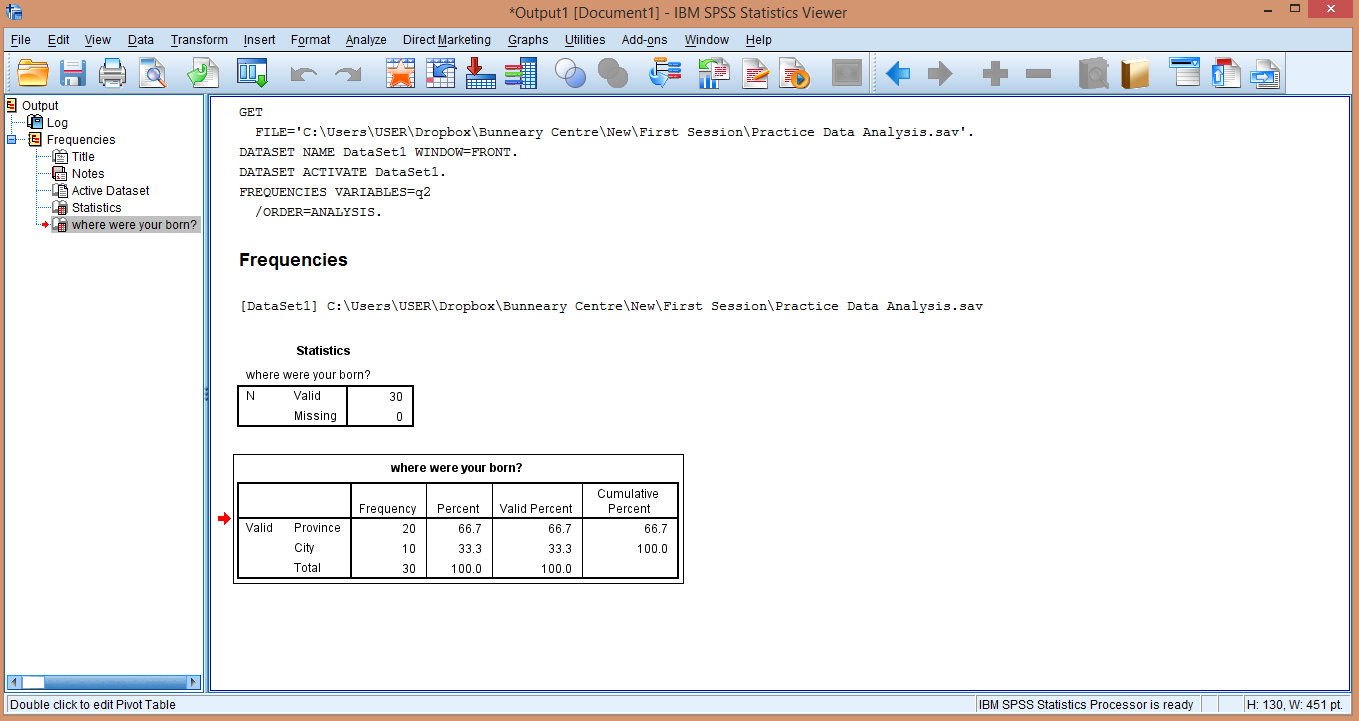
Output Viewer window - researcher can run the Syntax, afterward they will receive the output viewer window. The output viewer window contains all the result of SPSS data analysis. In short, output viewer window is place where demonstrates the result of SPSS data analysis.
Figure 3: IBM SPSS Statistics Viewer
Conclusion
Learning SPSS, researcher needs to understand each element of the SPSS windows - Data Editor, Syntax, and Viewer.
The next session is going to present about the "How to perform variable view and data entry"?